Dashboard
The Dashboard is your landing page after logging in, providing a quick overview of your API usage and available document conversions. It offers visual insights into your conversion activity.
Progress Bar
The Progress Bar helps you track your document conversions.
Recurring Plan:
- Displays the number of document conversions used vs. the total available in your subscription period.
- Tooltip Information: Hover over the Progress Bar to view the expiration date for your recurring document conversions.
info
The Progress Bar stays visible as you navigate through other sections, ensuring easy access to your usage overview.
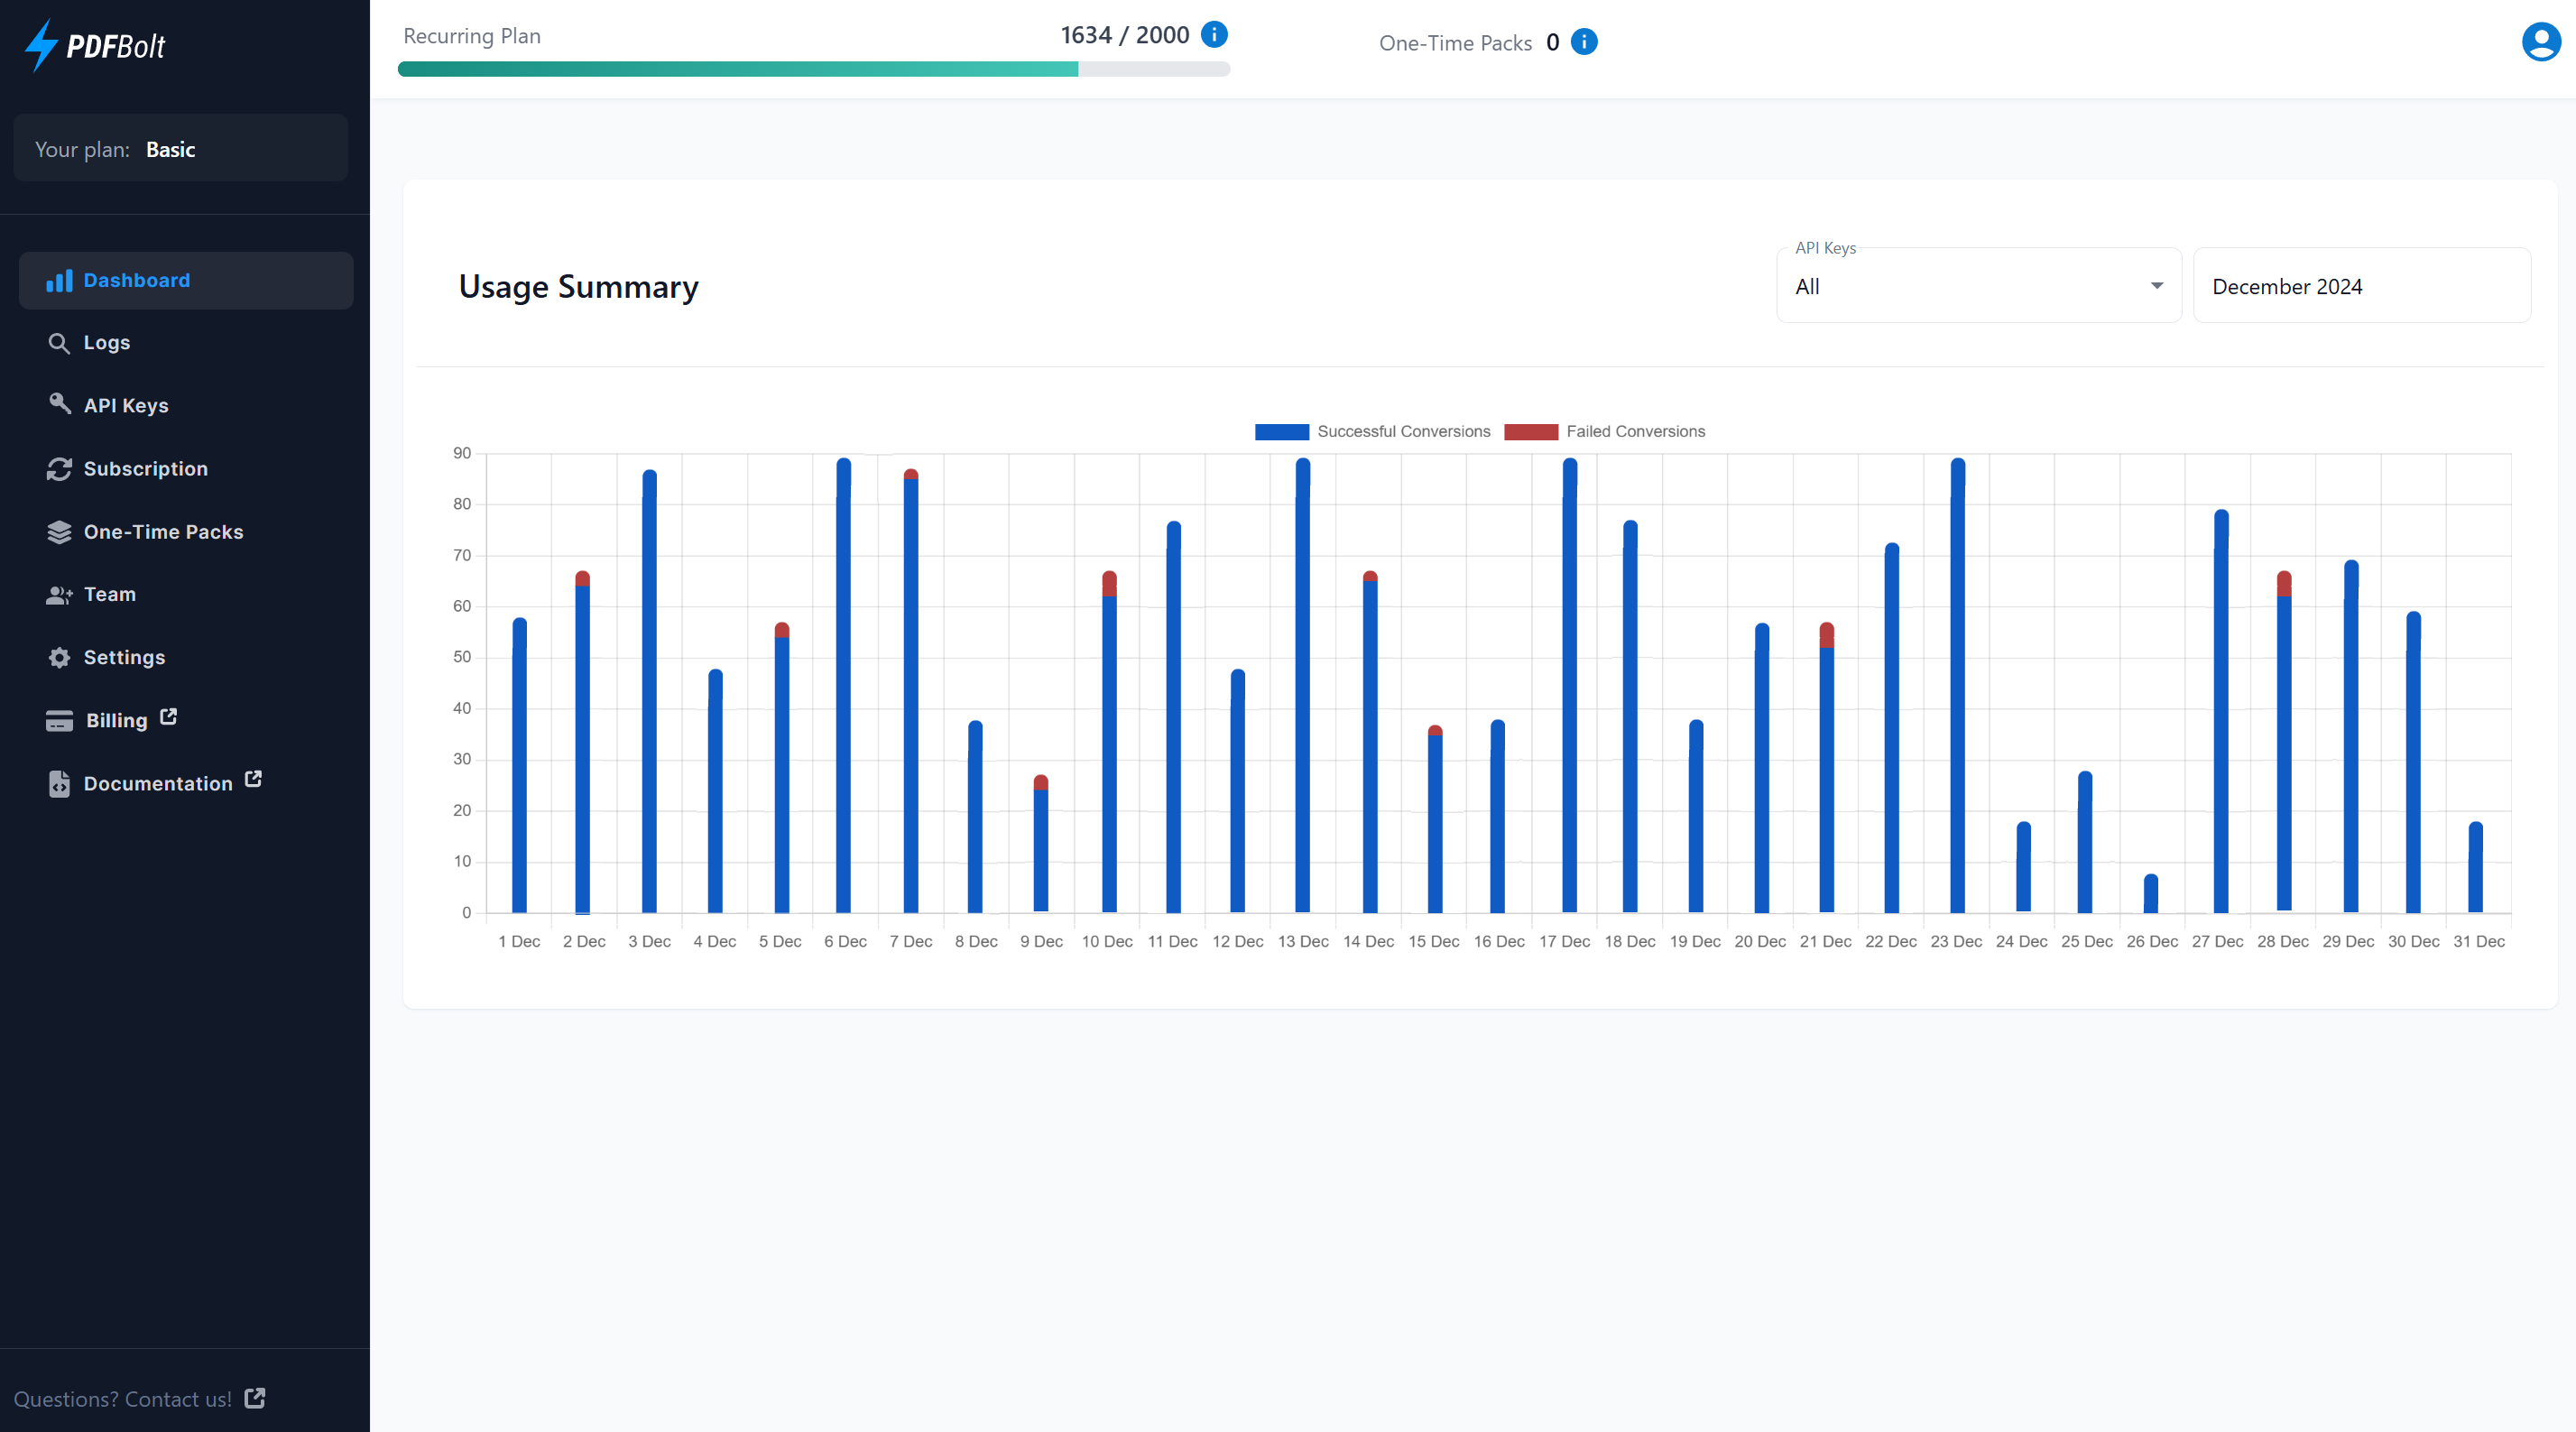
Usage Summary Chart
The Usage Summary Chart allows you to analyze your API request activity.
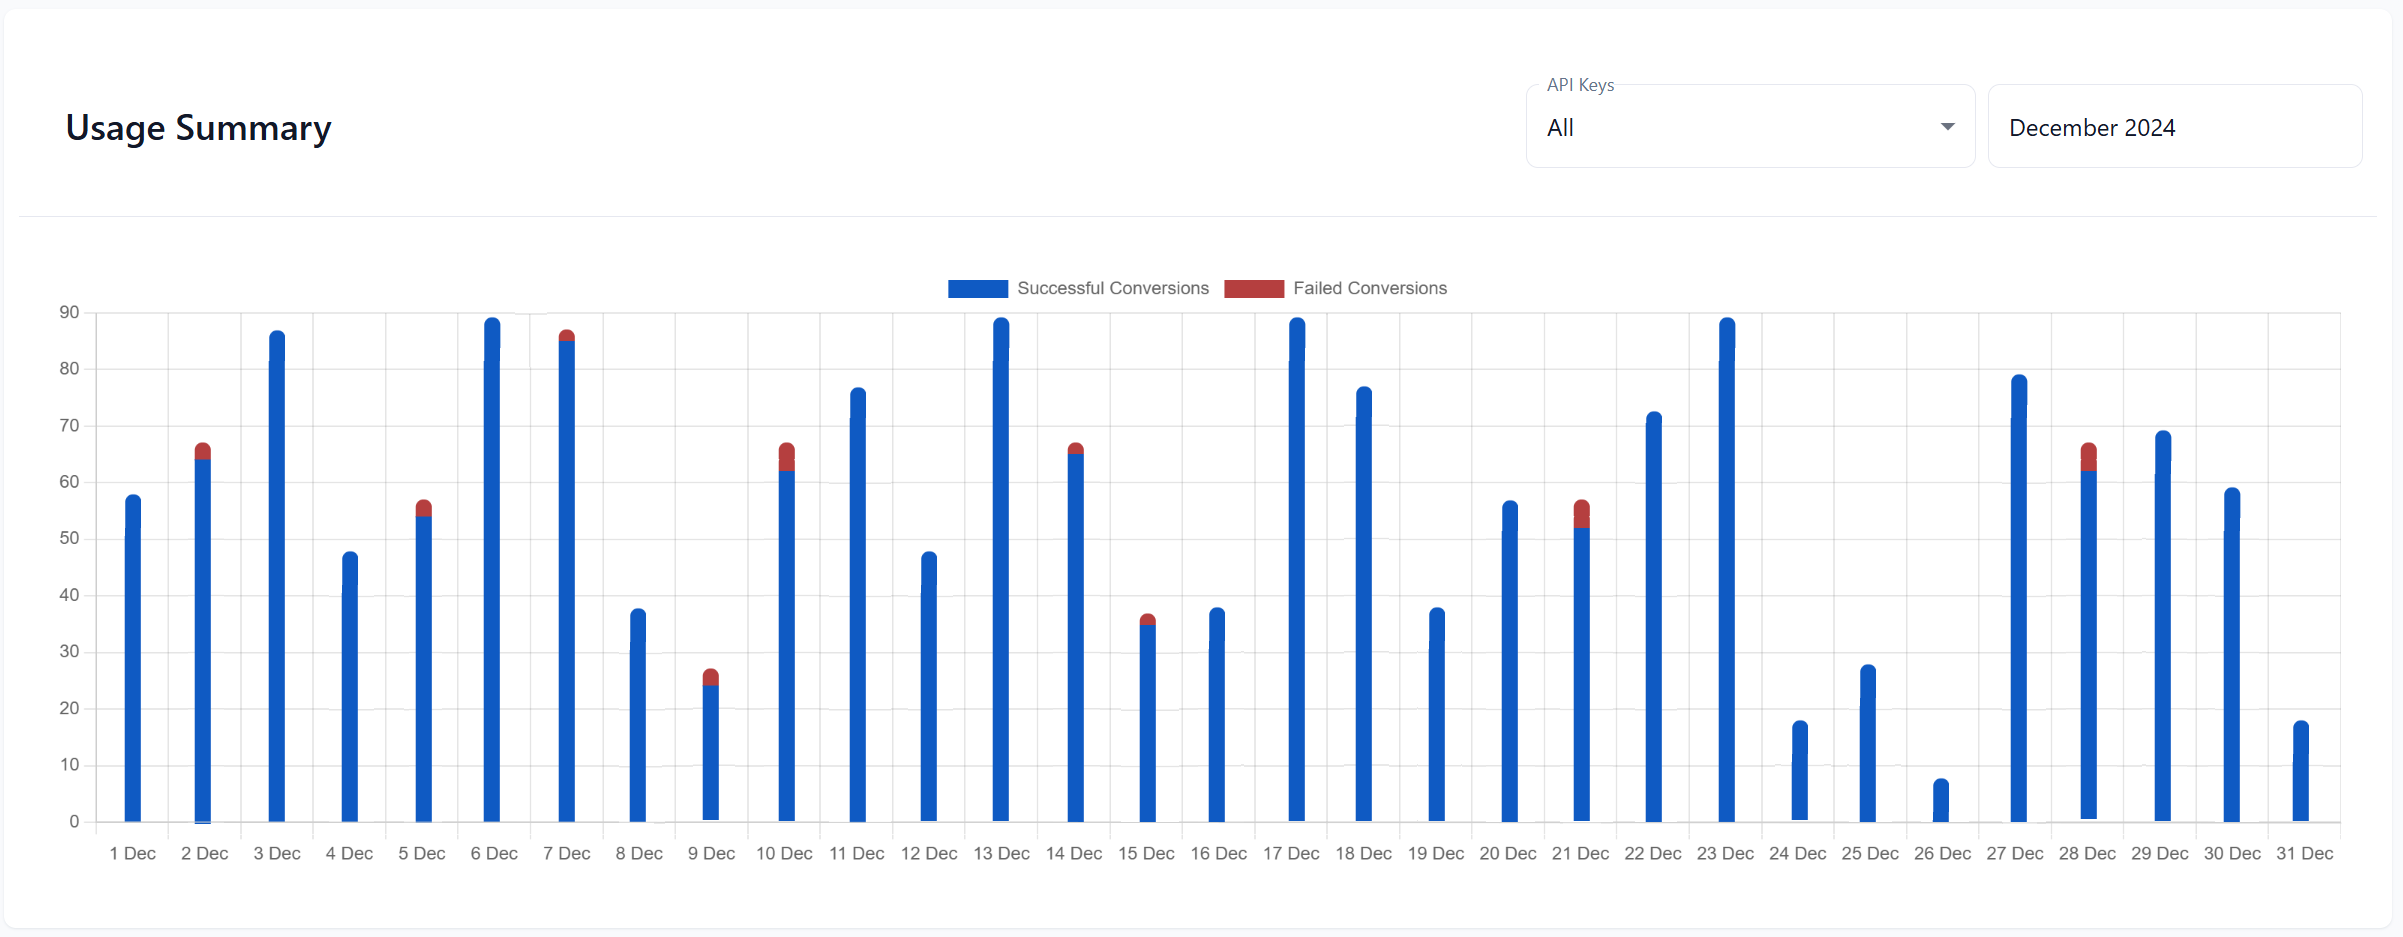
The Usage Summary section provides:
-
Daily Breakdown: Displays the total number of successful and failed requests for each day.
-
Filter by API Key: Allows you to analyze activity for specific API keys when using multiple keys.